
139,838,160 possible EuroMillions combinations — that's the total either way, and swapping my paper frequency charts for an AI lottery tool hasn't shifted it by a single digit. As a maths teacher who plays every week, what's actually changed is how confidently I put a set of numbers in front of the five other people who trust me with their share of our syndicate money.
Right then, before anything else: some of the links in this piece are affiliate links to tools I've paid for and tested myself, and if you click through and buy one I earn a small commission at no extra cost to you. That doesn't buy my opinion, and it definitely doesn't touch the maths — EuroMillions has a negative expected value no matter which tool picks your numbers or how clever its dashboard looks.
The Logic Behind Running Two Systems at Once
During the day I teach Year 10s how to factorise quadratics, which is either useful preparation for lottery scepticism or entirely irrelevant, depending on your view of teenagers. Somewhere between marking and the next lesson, I started keeping a proper log of every prediction method I tried against the actual draw results, rather than trusting my gut about which one felt cleverer.
That habit began with a YouTube channel, of all things, that recommended picks based on numerology — treating certain numbers as personally significant because of names or dates, that sort of thing. I followed its suggestions for a run of draws out of curiosity more than belief, and the results were exactly what you'd expect from a method with no connection to how balls actually leave a machine: unremarkable, indistinguishable from picking numbers off a bus timetable.
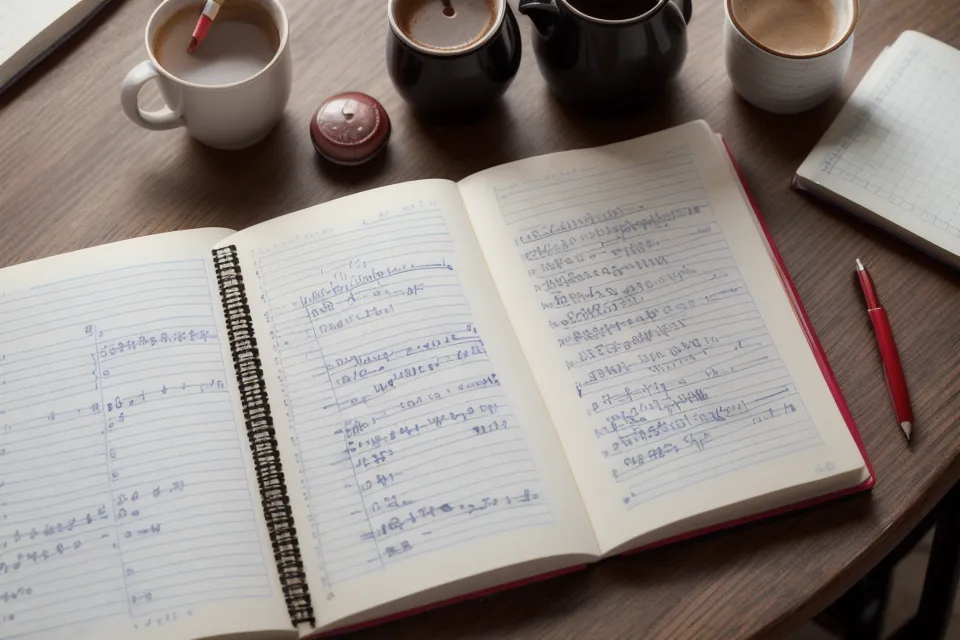
What I do now instead is what I'd call parallel testing, though that's a fairly unglamorous name for a simple idea. Each week I generate one set of numbers from my own frequency chart — a tally of how often each ball has come up historically — and a separate set from whichever AI lottery tool I'm reviewing, then I log both against what the machine actually draws. Neither method is trying to predict the future. What the comparison actually tells you is whether a tool's filtering logic holds up against a much simpler manual method, or whether it's just repackaging the same frequency data behind a nicer interface. I still remember standing at the photocopier waiting for a stack of worksheets to churn out, catching myself genuinely curious about that Friday's draw rather than just going through the usual motions. That was probably the moment the notebook stopped being a hobby and became something closer to an audit.

Does 'Overdue' Actually Mean Anything?
Ask any group of players and someone will mention a number that's "overdue", or one that's gone cold and won't show for months — the same mistake as expecting tails because a coin has just landed heads five times running, and it's wrong for the same reason, since every draw is independent of the last, which is the whole randomness argument in one sentence. The balls have no memory of last Tuesday, let alone last year.
None of that makes frequency data useless — it just measures something narrower than people assume, showing how numbers have landed over hundreds of past draws rather than what's coming next. The overall odds of winning any prize sit at around 1 in 13, and no amount of watching for "hot" or "cold" patterns moves that figure by a fraction.
Good Lottery Analysis Tools Filter Noise, Not Predict Draws
What LottoChamp and tools like it are actually doing, underneath the marketing language, is pattern detection at a scale I can't manage with a spreadsheet and a free evening. It cross-references a historical draw database and filters out combinations that almost never appear in real draws — five numbers in a row, say, or a set clustered entirely in one column of the slip. The one giveaway that it's doing real work rather than sitting idle is the laptop fan spinning up for a few seconds every time it re-sorts the full draw history, which is a strangely reassuring sound for anyone who likes their maths to look like effort. None of these companies publish their exact algorithm, so a fair chunk of evaluating any of them comes down to auditing what comes out the other end rather than trusting the pitch.
I judge a tool on a short, boring list of criteria: does the database actually update, does the filtering logic hold up against the maths I already know, and is there a way out if it turns out not to suit me. LottoChamp cleared that bar for me partly because of its 60-day money-back guarantee, which at least suggests the people behind it are willing to be tested against results rather than testimonials. If you want the fuller breakdown of how EuroMillions number probability actually works before trusting any tool's claims, I've written that up separately, and it's worth reading before you hand over your Saturday evenings to an algorithm.
Keeping a Syndicate Onside
Running a small syndicate changes the psychology of picking numbers more than it changes the maths. Put forward five numbers in a neat row and we don't win, I look reckless; point to a tool that filters out statistically improbable combinations, and I at least look like I've done some thinking. My neighbour Fenella plays entirely on gut feeling and whatever her lucky dip spits out, and she finds my frequency charts baffling but charming — which might be the most honest review any of this has ever earned.
For a syndicate manager who wants something simpler than a full analytics dashboard, Lotto Master Key strips away a lot of the overwhelm; its sales page converts well, with a stated conversion rate of around 1.66%, likely because it doesn't try to be everything at once. I looked at whether Lottery Defeated is worth the cost for a group that plays across formats, since the sensible filters shift with game format in ways that catch people out more than you'd think. Using a tool to visualize draw patterns also does something useful for group trust: it turns "I've got a feeling about 27" into a conversation the whole syndicate can actually follow.
A few honest caveats belong here too. I didn't build wheeling systems into this comparison at all, since that's a separate branch of maths with its own trade-offs. Over a short run of draws, sample size alone can make an average tool look either inspired or useless, so I don't read much into any single week's result. And the sunk cost trap is a real risk with any paid tool — the more you've spent trying to make a system work, the harder it becomes to admit it isn't, which is exactly why I keep a running note of what I actually spend on tickets and software, kept entirely separate from anything I've won.
Does Any of This Work Outside EuroMillions?
Dariusz Wojcik, a reader who plays both EuroMillions and Poland's Multi Lotek, emailed after reading my frequency chart tutorial to ask whether the same method holds up across lottery formats with different pool sizes. It's a fair question, and it exposed an assumption I hadn't fully examined: a filter tuned to one game's pool doesn't automatically transfer to another, which is really a cross-market portability problem more than a maths one.
His question is a decent reminder that none of this is really about my particular numbers. It's about whether a method's logic survives being tested by someone playing a completely different game, which is a far better check than whether it feels convincing on a Tuesday.
The Notebook Goes in the Drawer, Not the Bin
After two years of keeping this notebook, I'm not going back to a purely manual spreadsheet, though the spreadsheet isn't going in the bin either — it's still how I check the tools' working. What's changed is the clerical load: the AI side does the tedious cross-referencing, which frees up the time I'd rather spend deciding whether a filter actually makes mathematical sense. None of it touches the 1 in 139,838,160 odds of the jackpot, and it never will, whatever any sales page implies.
If you want to see how a database-driven approach changes your own selection process, LottoChamp is the one I keep coming back to for that kind of analysis, mainly because the historical database actually gets used rather than sitting there for decoration. And if you're setting one of these tools up for the first time, the practical walkthrough on setting up your first AI lottery strategy covers the actual configuration choices — which draws to include, how far back to weight the data — in more detail than I've gone into here.
Play within what you can afford to lose, keep whatever notebook or spreadsheet keeps you honest, and don't let any tool, mine included, talk you out of what the maths already tells you about the odds.