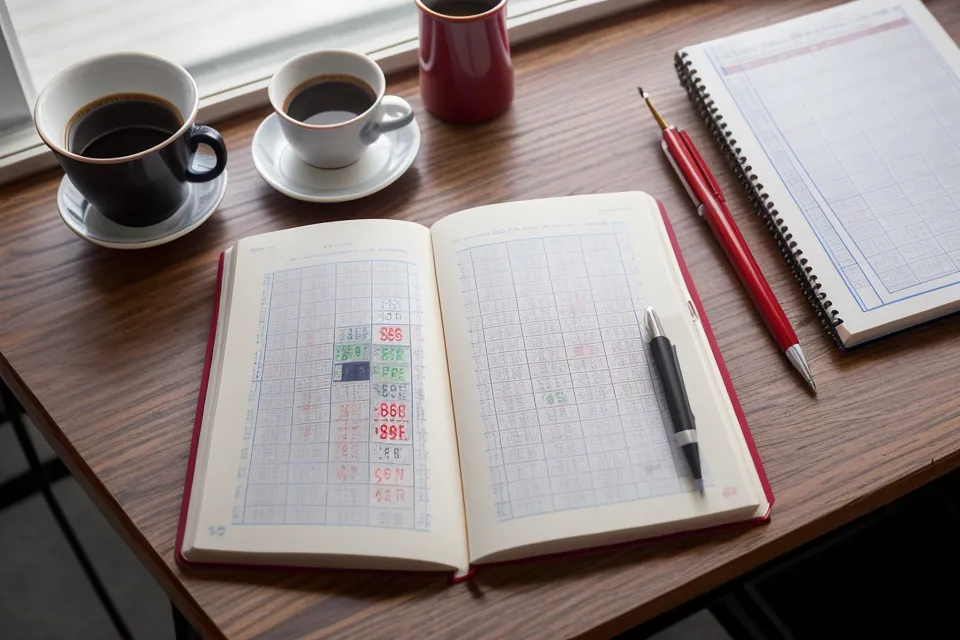
Red pen in hand, I'm marking a stack of Year 11 worksheets when I spot it in the margin of my own EuroMillions tracker, tucked under the pile: the same three numbers, circled twice, two draws running, with "overdue?" scribbled next to them in my own handwriting. That's the exact moment the overdue-number myth stopped being something I rolled my eyes at online and turned into something I'd apparently talked myself into half-believing.
Before getting into why that circling is a mistake rather than a lead, the housekeeping: this piece carries affiliate links to a handful of AI-driven number-analysis tools I've tested against my own frequency charts, and buying through one earns me a small commission at no extra cost to you. I teach maths for a living, I buy a EuroMillions ticket most Fridays at a shop near my flat in the Northern Quarter, and I've spent a long stretch running three different pieces of lottery-probability software against a plain paper notebook to see which EuroMillions strategy, if any, actually earns its keep. Call this my maths teacher's review of what holds up and what doesn't.
The Overdue Number Myth, and Where My App Got It Wrong
A few months back I downloaded an app that promised to flag which EuroMillions numbers were "overdue" for a reappearance, ranked by how long each one had gone unpicked. It looked properly clever, with graphs and a countdown timer for every ball. Underneath the interface, though, it was just the gambler's fallacy wearing a nicer font, treating every draw as if the machine remembered what it did last Tuesday. It doesn't remember anything. A EuroMillions machine has no memory, and neither does a coin or a deck of cards: the probability of any specific number landing this Friday is exactly what it was last Friday, overdue label or not. Kill that myth first, because most of the bad lottery advice floating around online is a variation on it.
Zainab, a university friend who studied maths alongside me and now works as a software developer in Leeds, still reads through my scripts when I ask her to, even though she won't play the lottery herself, on principle. When I showed her the overdue-number app's logic, she pointed out it was sorting on noise and presenting it as signal, which is a more polite way of saying the whole premise was rubbish dressed up in good typography. She was right, and that's the one definite failure in all of this: the app got deleted, and I went back to counting by hand while I looked for something that could actually show its working.

What Number-Analysis Tools Can Actually Spot
Short answer: it can spot clusters in the data, but a cluster isn't the same thing as a pattern that will repeat. Two of the tools I keep running against my own numbers are LottoChamp, which scans years of historical EuroMillions draws for frequency clusters in seconds, and Lotto Master Key, a lighter system that does something similar without the dashboard. Both are doing frequency analysis at a scale no one could manage by hand, which sounds impressive until you remember that human brains do the opposite job badly — we're wired to see streaks and clusters in genuinely random sequences, the same instinct that makes a coin look "due" for tails after three heads in a row. That's one reason why my desk drawer notebook proved that AI lottery analysis beats guessing patterns: software doesn't get bored, distracted, or sentimentally attached to a number it played last Christmas.
None of that makes the output trustworthy on its own, though. Most of these platforms don't show their working — you get a list of suggested numbers with no visible formula behind it, which is a transparency problem for anyone used to checking their own maths. A method that back-tests beautifully against last year's draws hasn't proven anything about next year's; it can just as easily have been fitted to noise that won't repeat, which is the same trap as judging a revision technique purely by how well it worked on last year's mock exam. A tool like Lottery Defeated takes a similar frequency-counting approach and points it at the big multi-state American draws as much as EuroMillions, which tells you the underlying method travels across formats even though I've got no opinion worth sharing on strategy for a game I don't actually play.
Running Three Lottery-Probability Tools Against My Own Frequency Chart
Setting any of these tools up is mostly about telling them which game to track and how far back to pull historical draws — a step that takes longer to explain than to actually do. Once that's sorted, I let each one run against the same stretch of EuroMillions results I've already logged by hand, comparing picks number for number rather than trusting a results page on faith.
A reader named Neville Ashworth, a retired civil engineer from the Wigan area, tracks every EuroMillions draw in a paper ledger rather than a spreadsheet. He once compared my chart's methodology to a structural load calculation in a comment under one of my early posts, and he still sends a handwritten note that turns up roughly a week after each draw, usually pointing out exactly where his tally and mine disagree. His approach proves the underlying point better than any software could: the maths behaves the same whether you track it with a biro or a database.
Here is the thing though, "hot" numbers get treated with the same false confidence as "overdue" ones, just pointed in the opposite direction. A number that's come up often in your sample isn't "on a streak" any more than a coin landing heads four times running is "due" a fifth. It's a small sample doing what small samples do, which is wobble, and that's really a question of sample size rather than destiny: stretch the same frequency chart over a bigger run of draws and most of those hot streaks flatten out towards the same baseline as everything else. Wheeling systems promise to get around this by covering more number combinations across a ticket set, and they do technically improve your odds of catching a smaller prize somewhere in that set, but they do nothing to change the expected value of any single line, and the extra cost of those extra lines usually cancels out whatever edge you think you've bought.

LottoChamp, Lottery Defeated, and Lotto Master Key Don't Do the Same Job
Judge any of these three on the same criteria you'd use for a calculator, not a crystal ball, and the differences get easier to weigh up. LottoChamp carries the deepest historical database of the three and updates it weekly, which matters more than people think, because a frequency count built on a thin slice of draws is just noise with a trend line drawn through it. Lottery Defeated is built with the bigger American number pools in mind as much as EuroMillions, so if your spending splits across formats, it's the one that won't make you switch tools mid-week. Lotto Master Key strips the dashboard right back, which suits anyone who wants a straightforward system without learning to read a spreadsheet first.
None of that changes the game format sitting underneath each tool. EuroMillions draws from a pool of 50 main numbers and 12 Lucky Stars, and the raw odds of a jackpot line don't shift no matter which software counted the frequencies for you. If you want to see exactly why certain combinations — three consecutive numbers, say — aren't secretly luckier or unluckier than any other combination, why consecutive lottery numbers probability matters is worth a proper read; the short version is that every specific combination, consecutive or scattered, has exactly the same chance of being drawn.

Treat the Tool as a Calculator, Not an Oracle
This isn't an argument against playing. It's an argument for knowing what you're actually buying. A tool that organises years of EuroMillions history into a clean frequency chart is doing something genuinely useful — it's just not shortening odds of 1 in 139,838,160 by so much as a decimal point. The useful habit isn't chasing a system; it's setting a figure you're happy to lose before you start, treating any extra spend chasing last week's near-miss as the sunk-cost trap it plainly is, and walking away from a losing run exactly as easily as you would a winning one.
My Year 11s would find it hilarious that their maths teacher spends evenings running spreadsheets against a lottery ticket. They'd also, eventually, get the actual lesson underneath it: probability doesn't owe you a pattern just because you went looking for one, and the best any tool — mine, Zainab's, or Neville's paper ledger — can do is organise the noise so you stop mistaking it for a signal.
Check out LottoChamp to see the pattern detection I used in my experiment.
| Product | Rating | |
|---|---|---|
| LottoChamp Top Pick | 9.2 | Read More → |
| Lottery Defeated | 8.7 | Read More → |
| Lotto Master Key | 8.1 | Read More → |
LottoChamp
Pros
- ✔ AI-driven pattern detection that handles years of data in seconds
- ✔ Includes a massive, weekly-updated historical draw database
- ✔ 60-day money-back guarantee provides a safety net for testing
Cons
- ○ The interface looks a bit like a legacy Windows app
- ○ Requires a bit of a learning curve for those who hate spreadsheets