
A key question in my six months of lottery analysis has been whether a program can spot something in a run of EuroMillions draws that a spreadsheet and a biro can't. I've been testing AI-powered probability tools against my own manual data tracking, and this is what readers ask most, usually before I've got to the interesting part.
Quick disclosure before we get into it: some of the links below are affiliate links to the tools I mention, and I earn a commission if you buy through one, at no extra cost to you. I only write about software I've actually run against my own numbers for months, I'm not a financial advisor, and EuroMillions has a negative expected value no matter which app tells you otherwise.
Does an AI Tool Actually Find Something a Spreadsheet Can't?
Short answer: sometimes, and it's worth being precise about what "something" means. A coin doesn't remember its last flip, and neither does a EuroMillions machine — that's basic probability, not opinion. What a tool like LottoChamp can do that a manual chart struggles with is process thousands of historical draws at once, instead of the twenty or so I could realistically log by hand on a Sunday evening.
None of that changes the randomness of the next draw itself — each one is independent of the last, which is exactly why so many of the patterns players chase don't mean what they think they mean. Whether spotting a lopsided run in thousands of past draws counts as real pattern detection or just faster arithmetic with a nicer interface is its own argument, and reasonable people land on both sides of it.

What Roisin Keeps Asking About Sample Size
A reader called Roisin emails in most months, and her questions are the kind that make you tighten up an explanation rather than repeat it. Her recurring one: how many draws do you actually need before a pattern means anything? Fair question — six months of parallel picks is nowhere near enough to draw a firm conclusion on its own, and the variance in a small sample can make a mediocre tool look brilliant for a few weeks purely by chance.
The 'Hot Numbers' Spreadsheet That Wasted Three Months
Pretty much, yes, and I say that as someone who followed one for three months straight. Early in the project I found a "hot numbers" spreadsheet on a lottery forum, the kind that tracks which balls have come up most in recent draws, and I stuck to its picks religiously on the theory that momentum meant something. It didn't — the results were no better than picking numbers off a bus timetable, which is roughly what you'd expect once you remember that hot and cold numbers are one of the most misunderstood ideas in this whole hobby, and that each draw has no memory of what happened the week before.
What changed things wasn't one dramatic moment. I remember standing at the photocopier in the staffroom one morning, half-watching worksheets stack up in the tray, and realizing I was genuinely curious what Friday's draw would bring rather than just checking out of habit. That's roughly when I started taking my own frequency chart — the kind you can build yourself with a pen and a few months of results — a bit more seriously, as a discipline rather than a hobby.
Weighing LottoChamp Against Lottery Defeated and Lotto Master Key
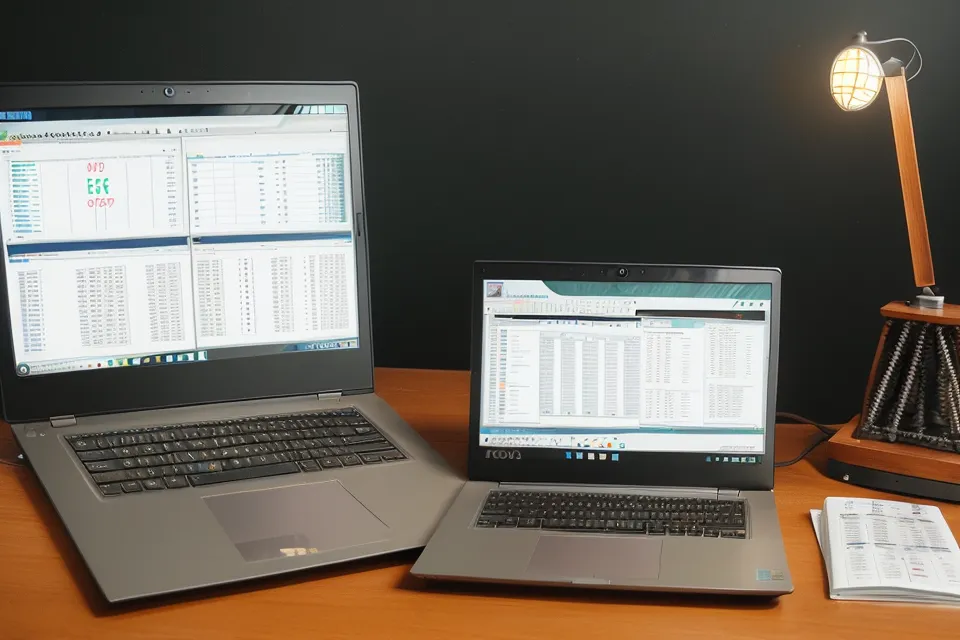
All three tools got a run during the six months, and they're not really solving the same problem. Lotto Master Key leans on a simple wheeling system, a way of combining a shortlist of numbers into multiple tickets, which suits someone who wants a method without wading through charts. LottoChamp goes further, looking at spacing between appearances and pairings rather than just raw counts, and setting it up properly meant telling it exactly which draws and games I actually play rather than leaving the defaults untouched.
One clear example of the difference: LottoChamp flagged a pair of numbers that had gone quiet for weeks, right when my own manual chart was still fixated on numbers that felt "due" — a bias I warn my students about constantly and still fell for myself. I've kept every result from that stretch, hits and misses both, in the maths teacher notebook I use to track the parallel test properly, because a method only means something if you can check it later rather than just remembering the good weeks.
Lottery Defeated is a genuinely capable piece of software, but it's built around Powerball and Mega Millions first, games with a different number range and odds table entirely, which tells you plainly it wasn't designed with a Tuesday-and-Friday EuroMillions habit in mind. Whether a pattern tool built for multi-state American games ports cleanly to a two-country European draw is really a separate question, and not one I'll settle here. Lotto Master Key, by contrast, stays deliberately simple — if lots of charts and settings overwhelm you rather than help, it's the one that gets out of your way fastest, though it can feel a bit basic once you're used to digging into the data yourself. If you want to see how far manual charting can take you before software is worth the switch, there's more in my piece on probability patterns in historical draw data, and I put the two AI options head-to-head — cost, features, and how each one actually reasons through a pick — in my honest comparison of AI lottery tools.

Is Any of This Worth Doing, or Just a Way to Feel in Control?
Cillian, who teaches PE two doors down from my classroom, asked me almost exactly that, grinning the whole time, when he spotted the notebook on my desk again. It's a fair challenge. Part of what keeping results in writing does is stop me falling into the sunk cost trap — the sense that because I've already put time and money into this, I should keep going even when the numbers say I'm not ahead, a trap no algorithm fixes for you. I also care about being able to see why a tool suggested a particular number rather than just trusting a black box, and that kind of transparency varies enormously between platforms — some show their working, some just hand you six numbers and a shrug.
Tracking the actual spend on tickets and subscriptions alongside the picks matters too, not because the maths ever tips in your favour, it doesn't, and it structurally can't, but because seeing the numbers side by side is the only honest way to know whether a habit has quietly grown bigger than you meant it to.
The Actual Verdict on AI Lottery Analysis After Six Months
No tool broke the maths, and none of them were ever going to. It's not a criticism, it's just how the game is built. What six months of parallel testing actually showed is that software is far more consistent than I am at organising a large pile of historical numbers without getting tired or skipping a stretch of data by accident, the way I once did with a hand-built chart. If you want a starting point that respects how the numbers work rather than promising anything they can't, LottoChamp is the one I keep coming back to, mostly because it shows its reasoning rather than asking you to trust it blind.
If you're curious enough to try it yourself, LottoChamp is below, along with what it actually got right and wrong across my testing. Treat it as a way to spend less time on chart-keeping and more time understanding why the numbers behave the way they do, not as a shortcut past the odds, set a budget before you start, stick to it regardless of what the software suggests, and if any of this starts feeling less like curiosity and more like compulsion, that's worth taking seriously.
LottoChamp
Pros
- ✔ Superior AI pattern detection across multiple lotteries
- ✔ Comprehensive historical database updated weekly
- ✔ Solid 60-day money-back guarantee for peace of mind
- ✔ Helps eliminate human error in frequency tracking
Cons
- ○ Interface feels a bit dated compared to modern apps
- ○ Requires a bit of a learning curve to use all features