What would you trust more to pick your EuroMillions numbers: six months of your own tally marks, or an AI tool that claims to spot patterns your pen can't? That's the question I get asked most, often by people who assume a maths teacher must have cracked some code the rest of us missed.
Right then, here is the honest version: neither one beats the maths. A frequency-analysis spreadsheet built from six months of draw data and three different AI prediction tools gave me extremely similar odds of winning, precisely because the odds themselves never move. What actually differs between the two methods is far less dramatic than any lottery forum would have you believe, and it has nothing to do with chance magically favouring one system over another.
Does an AI Lottery Tool Actually Beat a Manual Spreadsheet?
Three different AI platforms ran alongside my own frequency-analysis spreadsheet for six months, both tracking the same Tuesday and Friday draws without fail. Every combination any of them produced carried exactly the same negative expected value as a combination scribbled on the back of a receipt, because that's simply how a draw with no memory works.
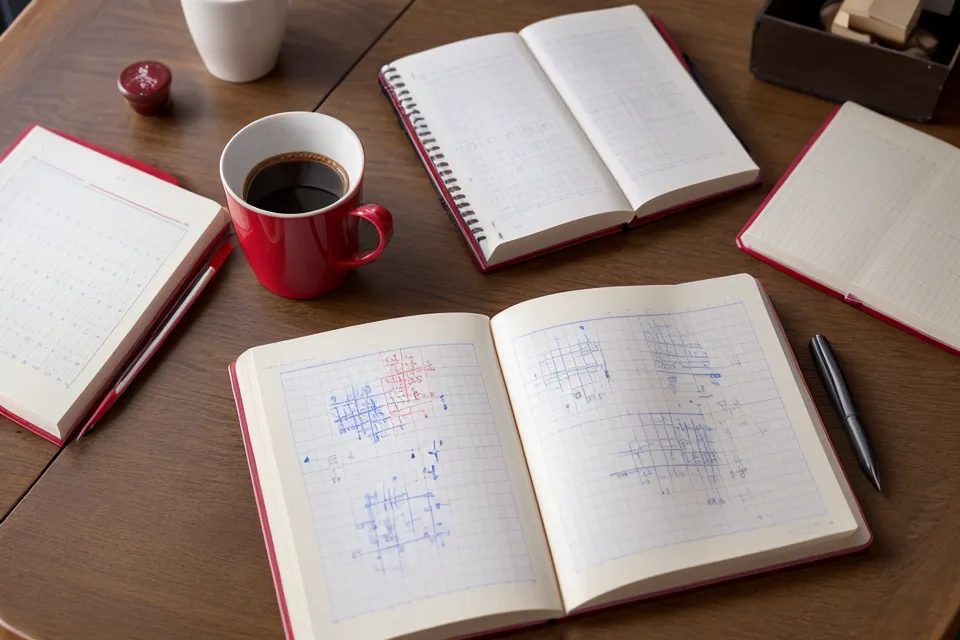
Probability doesn't keep score of what happened last Tuesday, which is the single hardest idea to get across to anyone, teenager or adult. Even so, writing everything down changes how you think about the numbers, if not the odds themselves. There's a small, particular satisfaction in the click of a ballpoint working its way down a tally column after a draw, four straight lines and a diagonal fifth, about the only part of this whole process that feels tactile rather than theoretical.

My Frequency Chart and the AI Agreed More Than I Expected
One Friday evening at the kitchen table, I checked my own top picks against that week's AI shortlist and found three numbers sitting in both lists, chosen completely independently of each other. It wasn't a sign of anything mystical, just a reminder that a frequency chart and a pattern-sorting tool will occasionally land on some of the same numbers out of a pool of fifty, purely because both methods are drawing from the same finite set.
Frequency charts and "hot and cold number" theories get thrown around constantly in lottery forums, and both deserve a longer, more careful explanation than I can give here without wandering off topic entirely.

The Year I Spent Playing the Same Birthday Numbers
Before any of this testing started, I played the same set of numbers pulled from family birthdays for an entire year, convinced that sentimental consistency counted for something. It didn't. Those numbers came up no more often than any set I could have picked blind, a fact that's obvious on paper but strangely hard to accept once you've attached a story to a set of digits.
Patterns like birthdays, anniversaries, or anything under thirty-one feel meaningful because we're pattern-seeking animals, not because the draw machine in Paris cares what day your nephew was born. If you want the longer version of why so many "meaningful" number sequences are mathematically identical to any other combination, I've gone through that properly in Identifying Common Myths About EuroMillions Number Sequences.
What a Friend Renovating a Levenshulme Terrace Asked Me
A friend of mine, currently knee-deep in renovating a Victorian terrace over in Levenshulme, asked me recently why I bother running an AI tool at all if the odds never change. Fair question. The honest answer is spread, not prediction: across six months, the AI tools consistently produced number sets scattered more evenly across the pool of fifty than my own manual quick picks tended to be.
It's a different idea entirely from wheeling systems, which try to guarantee partial matches across multiple tickets rather than spread a single ticket's numbers out, and that's a rabbit hole for another day.
Should You Trust Hot Numbers, Cold Numbers, or Neither?
Neither, and that's not meant to be a clever dodge. Past frequency doesn't change next Tuesday's odds, full stop, which is the randomness every "hot numbers" spreadsheet eventually runs into. The only practical reason to care about spread at all is that a more evenly scattered ticket is less likely to be shared with a crowd of other players who all picked the same birthday-shaped cluster, which matters for your share of a prize, not your odds of winning it.
The Numbers in Paris Don't Care About Your System
The draw itself hasn't changed in the time I've been tracking it: seven numbers pulled from a pool of fifty main numbers and twelve Lucky Stars, with odds of exactly 1 in 139,838,160 for matching everything. That number doesn't care whether you built your picks in Excel or had an app suggest them for you.
Here is the thing though: the longer you track something like this, the easier it is to feel like you're owed a result for the effort, which is its own trap worth watching for, separate from anything mathematical.

Weighing a Spreadsheet Against an AI Tool, Honestly
If you're curious about the mechanics of how I actually log all this, from draw night through to updating both systems, I wrote the fuller version in My Notebook and the Algorithm: A School Teacher's Search for Sanity in Lottery Analysis. The short version is that the spreadsheet taught me more about why patterns feel meaningful, while the AI tool saved time producing a better-spread ticket without me doing the arithmetic by hand.
So here's where I've landed, for what it's worth to anyone deciding between the two: if you enjoy understanding the "why," build your own frequency sheet, because that's where the actual learning happens. If you just want a ticket that isn't accidentally identical to half the office's, let an AI tool handle the spread and spend your energy elsewhere. Either way, the maths underneath stays exactly the same, however it's arranged.